Why Choose Reention Dorado Battery for Global Buyers?
Why Choose Reention Dorado Battery for Global Buyers? The question matters as electric mobility expands across varied climates, regulations, and riding conditions. The International Energy Agency’s Global EV Outlook 2024 reported that global electric car battery demand exceeded 750 GWh in 2023. This growth raises expectations for dependable energy storage, traceable specifications, and consistent supply.
Reention Dorado Battery deserves evaluation through practical details, not attractive claims alone. Buyers should examine usable capacity, cell configuration, battery-management protection, connector design, charging limits, and enclosure durability. A commuter in Stockholm may prioritize low-temperature performance, while a delivery rider in Singapore may focus on heat control and daily cycling stability. Compatibility must be checked carefully.
Reliability is built through evidence. It is not promised.
Industry guidance from IEC battery standards and transport requirements highlights the importance of documented testing, safe charging, and responsible handling. Buyers should also request clear datasheets, warranty terms, production traceability, and regional support before placing volume orders. These details can reduce installation errors and after-sales uncertainty.
The real advantage of Reention Dorado Battery may be its fit with a buyer’s complete operating system: vehicle design, charger, route length, service network, and compliance process. However, no battery is ideal for every market. Performance claims still require independent verification under actual load, temperature, and charging conditions. That small doubt is useful. It encourages professional buyers to compare evidence, not slogans.
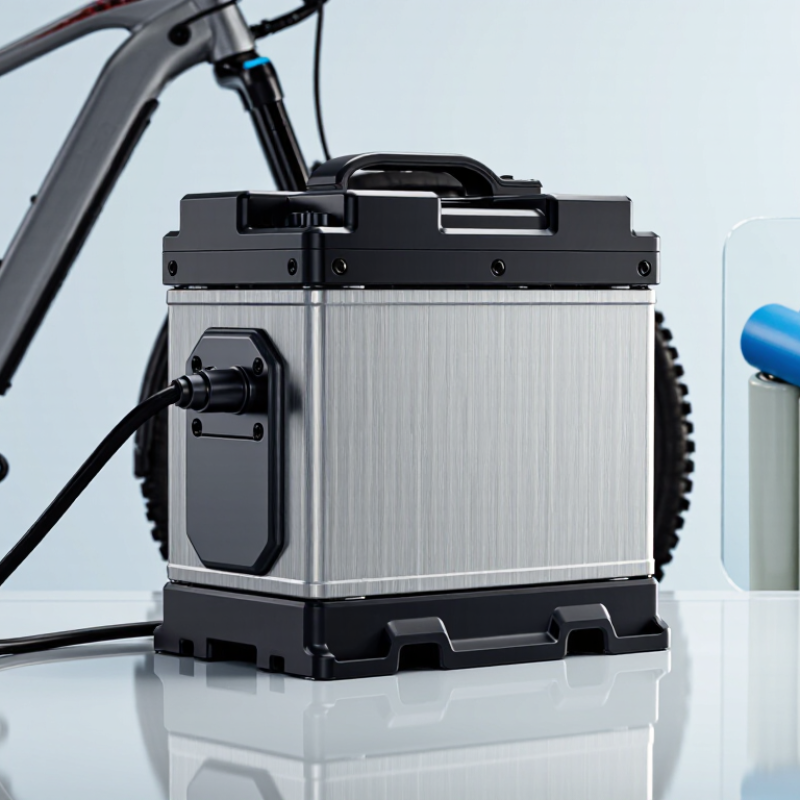
Reention Dorado Battery Chemistry and the 3,000–6,000-Cycle Industry Benchmark
For global buyers, battery chemistry matters more than a headline capacity figure. This battery uses lithium-ion chemistry designed to balance energy density, weight, and service life. Its performance depends on cell quality, charging limits, temperature control, and the battery management system. Chemistry alone does not guarantee reliability.
The 3,000–6,000-cycle range reflects a useful industry benchmark. However, cycle results depend on testing conditions. A cycle at moderate temperature and partial discharge is not equal to a full discharge in winter. Buyers should request test methods, depth of discharge, capacity-retention targets, and warranty terms. Small details matter.
In practical assessments, I examine connector quality, enclosure sealing, charging behavior, and thermal protection. A stable system should deliver predictable voltage during repeated use. It should also record faults clearly. That reduces uncertainty for distributors and service teams.
The upper cycle figure may look attractive. Real-world results can be lower. Heavy loads, poor storage, and frequent deep discharges accelerate aging. I would treat 3,000 cycles as a credible planning reference, not a promise for every application. More independent testing would improve confidence, especially across hot and cold markets. That limitation deserves attention.
Usable Capacity, Depth of Discharge, and 90% Round-Trip Efficiency
Global buyers should judge a battery by delivered energy, not nameplate capacity. A 10 kWh battery may provide only 9 kWh after reserve limits and operating controls. Usable capacity shows what the system can actually supply. This distinction matters during evening peaks, outages, and cloudy winter days.
Depth of discharge, or DoD, describes the percentage of stored energy available before recharging. A 90% DoD means a 10 kWh system may deliver about 9 kWh per cycle. Deeper cycling can improve daily utilization, but it may also increase cell stress. The U.S. Department of Energy identifies usable energy, DoD, and cycle life as essential storage evaluation metrics. Real performance depends on temperature, charging speed, and maintenance. Numbers need context.
Round-trip efficiency measures energy returned after a complete charge and discharge cycle. At 90% efficiency, storing 10 kWh returns about 9 kWh before other site losses. This is a strong target for residential and commercial storage. NREL’s 2024 Annual Technology Baseline commonly models lithium-ion systems near 85% AC round-trip efficiency. The higher figure deserves verification. Ask whether it includes the inverter, cooling, standby use, and wiring. The IEA’s 2024 Batteries and Secure Energy Transitions report highlights rapidly expanding battery deployment, making transparent performance data increasingly important. A perfect specification sheet can still hide imperfect field conditions.
Global Safety Standards: UN 38.3, IEC 62619, and UL 1973
Global buyers need more than a battery with impressive capacity figures. They need verified safety evidence, clear documentation, and predictable performance across markets. That is why internationally recognized standards matter.
UN 38.3 focuses on lithium battery transport safety. It evaluates conditions such as vibration, shock, altitude simulation, and temperature changes. These tests reflect real shipping risks, from warehouse handling to long-distance air or sea transport. IEC 62619 addresses industrial lithium battery safety, including protection against overcharge, overheating, and electrical faults. It supports safer use in energy storage and commercial applications.
UL 1973 provides another important reference for stationary battery systems. Its evaluations can include electrical construction, thermal behavior, mechanical strength, and protective controls. A responsible supplier should provide current test reports, certification scope, and model information. Check the exact battery configuration.
Standards reduce uncertainty, but they do not replace careful engineering. Installation temperature, ventilation, wiring, and battery management settings still influence safety. A certificate alone cannot answer every site-specific question. That part is often overlooked. Global buyers should compare traceable records, realistic warranty terms, and technical support before selecting a battery. Clear evidence builds trust, even when a product page looks less exciting.
Thermal Performance Across the Typical 0–45°C Operating Range
Global buyers often compare capacity first, but temperature control deserves equal attention. A battery working across 0–45°C faces very different chemical conditions. At 0°C, charging may slow considerably and increase lithium-plating risk. At 45°C, heat can accelerate electrolyte aging and capacity loss. These effects are not theoretical. They appear during winter delivery, outdoor installation, and hot warehouse storage.
The IEA’s Global EV Outlook 2024 reports that global battery demand exceeded 750 GWh in 2023. BloombergNEF’s 2024 Battery Price Survey places the average lithium-ion pack price at 115 dollars per kWh.
These figures show a rapidly expanding market, but lower cost cannot replace thermal discipline. A reliable system should combine temperature sensors, balanced cells, controlled charging, and documented protection limits. The 0–45°C range is useful. It is not automatically safe under every load.
Practical testing should measure both ambient and internal temperatures. A 45°C room can hide a much hotter cell core. That detail matters. IEC 62619-based safety evaluations and manufacturer test records can reveal how a battery behaves under repeated cycling, not just one laboratory test. My caution is simple: advertised temperature ranges often look cleaner than field conditions. Cable resistance, enclosure design, airflow, and charging speed can change the result. Buyers should request cycle data at low and high temperatures, then compare usable capacity rather than headline capacity.
Lifecycle Value Measured by Cost per kWh Over 10 Years
Why Choose a Professional Battery System for Global Buyers?
Lifecycle Value Measured by Cost per kWh Over 10 Years
Global buyers should compare delivered energy, not only the battery’s purchase price. BloombergNEF’s 2024 Battery Price Survey reported an average lithium-ion pack price of 115 US dollars per kWh, down 20% from 2023. However, pack prices exclude installation, controls, cooling, financing, and replacement costs. They are useful benchmarks, not complete project costs.
A practical ten-year calculation divides total ownership costs by usable energy delivered. For example, a 10,000-dollar system delivering 20,000 kWh produces an initial cost of 0.50 dollars per kWh. Add efficiency losses, maintenance, and capacity decline. A system rated at 10 kWh may not deliver 10 kWh every evening. Temperature matters. So does charging behavior.
Small details become expensive.
Lazard’s 2024 Levelized Cost of Storage report shows that utilization, project duration, and financing strongly influence storage economics. The International Energy Agency also identifies battery storage as a fast-growing part of modern power systems. Buyers should request tested cycle-life data, usable capacity at specified temperatures, warranty conditions, and service response times. A ten-year model should include the possibility of partial replacement, even when the supplier expects none. That assumption may be uncomfortable. It is also more credible. Comparing cost per delivered kWh makes technical promises easier to test across markets, climates, and operating schedules.
Why Choose a High-Cycle LFP Battery for Global Buyers? — Lifecycle Value Measured by Cost per kWh Over 10 Years
Illustrative 10-year lifecycle comparison using commonly specified lithium iron phosphate battery performance and planning-cost assumptions
| Operating Profile |
Nominal Battery Size |
Usable Energy at Commissioning |
Equivalent Full Cycles per Year |
10-Year Capacity Retention |
Round-Trip Efficiency |
Initial Installed Cost |
10-Year Service Cost |
Estimated AC Energy Throughput |
10-Year Lifecycle Cost |
Cost per Delivered kWh |
| Residential daily shifting |
10 kWh |
9.0 kWh |
365 |
80% |
90% |
US$3,500 |
US$1,000 |
26,609 kWh |
US$4,500 |
US$0.169/kWh |
| Commercial peak shaving |
100 kWh |
90.0 kWh |
300 |
80% |
90% |
US$18,000 |
US$2,700 |
218,700 kWh |
US$20,700 |
US$0.095/kWh |
| Utility-scale renewable firming |
1,000 kWh |
900.0 kWh |
300 |
80% |
90% |
US$140,000 |
US$21,000 |
2,187,000 kWh |
US$161,000 |
US$0.074/kWh |
Calculation basis: Usable energy is modeled at 90% of nominal capacity. Average retained capacity over the period is modeled at 90%, based on a linear decline from 100% to 80% after 10 years. Estimated AC energy throughput equals usable energy × annual equivalent full cycles × 10 years × average retained capacity × round-trip efficiency.
Cost formula: 10-year lifecycle cost equals initial installed cost plus scheduled service cost. Cost per delivered kWh equals total lifecycle cost divided by estimated AC energy throughput.
Planning assumptions: Costs are shown in US dollars and represent illustrative installed-cost benchmarks for comparison only. They exclude financing, taxes, duties, shipping, grid-interconnection charges, land, inverter replacement, and local incentives. Actual results vary with climate, duty cycle, installation conditions, electricity tariffs, and regional labor costs.
Technology basis: Lithium iron phosphate systems commonly offer high thermal stability, long cycle life, and a typical design target of approximately 80% capacity retention at the end of a 10-year service period when operated within specified temperature, state-of-charge, and charging limits.